
Bring InControl's Network Management API Into Your Own Platform
InControl API gives developers and operations teams programmatic access to network monitoring, device data, and management capabilities, so you can bring Peplink intelligence into the tools and workflows you already use.
What You Can Do
Integrate Network Data Into Your Tools and Workflows
The right API integration means your team stops chasing data and starts acting on it. Whether you're building a custom dashboard, automating reporting, or connecting network health to your existing operations tools, these are the capabilities that do the heavy lifting.

Real-Time Device Map
Pull live GPS and location data for all Peplink devices and render them directly in your own platform.

Usage & Bandwidth Data
Access WAN and SIM usage across hourly, daily, and monthly timeframes for reporting and billing.

Bandwidth Alerts
Track data consumption and configure alerts when usage exceeds defined thresholds.

Monitoring
Pull live connection status, health, and uptime across your entire device fleet.

Connected Clients
Access live connected client lists, per-client bandwidth usage, and client counts at both device and group level, useful for capacity planning, troubleshooting, and usage reporting.
Who It’s For
Built for the Teams That Run Critical Networks
InControl API is designed for organizations that need more than an off-the-shelf dashboard. Teams that manage complex, distributed networks and need the flexibility to build around their own workflows.

MSPs & Service Providers
Your Clients' Network Health, Inside Your Platform
Stop jumping between portals to chase status updates. Pull connection health, usage, and device data directly into your own Professional Services Automation (PSA) or portal, with billing and Service Level Agreement (SLA) figures that reflect real-time network performance.

Enterprise IT
Full Infrastructure Visibility, No Extra Tools
Keep your entire network in view without adding more tools. The InControl API lets you pull WAN health, device status, and usage data directly into your existing Network Management System (NMS), so you can monitor your entire infrastructure in one place.

Public Safety & Transportation
Real-Time Awareness When It Counts
When a dropped connection has real consequences, your team can't afford to switch between interfaces. Surface live GPS and WAN status directly inside your dispatch or operations platform. No context-switching, no delays.
Go Deeper
More Than Just Monitoring
InControl API also gives you access to deeper configuration and reporting data, so you can build more complete, end-to-end solutions.
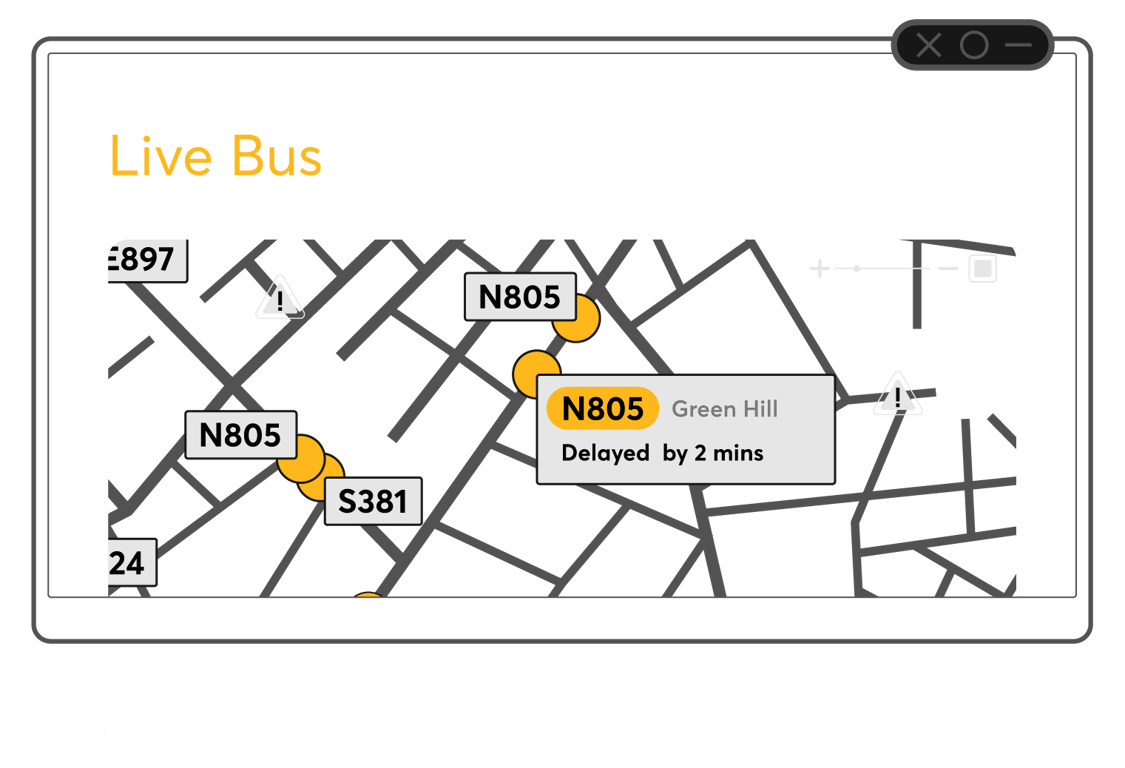
Advanced Device Management
The Router API unlocks a more convenient way to manage your devices. By combining it with the InControl API, you can execute those same device-level commands remotely, across your entire fleet, from anywhere.
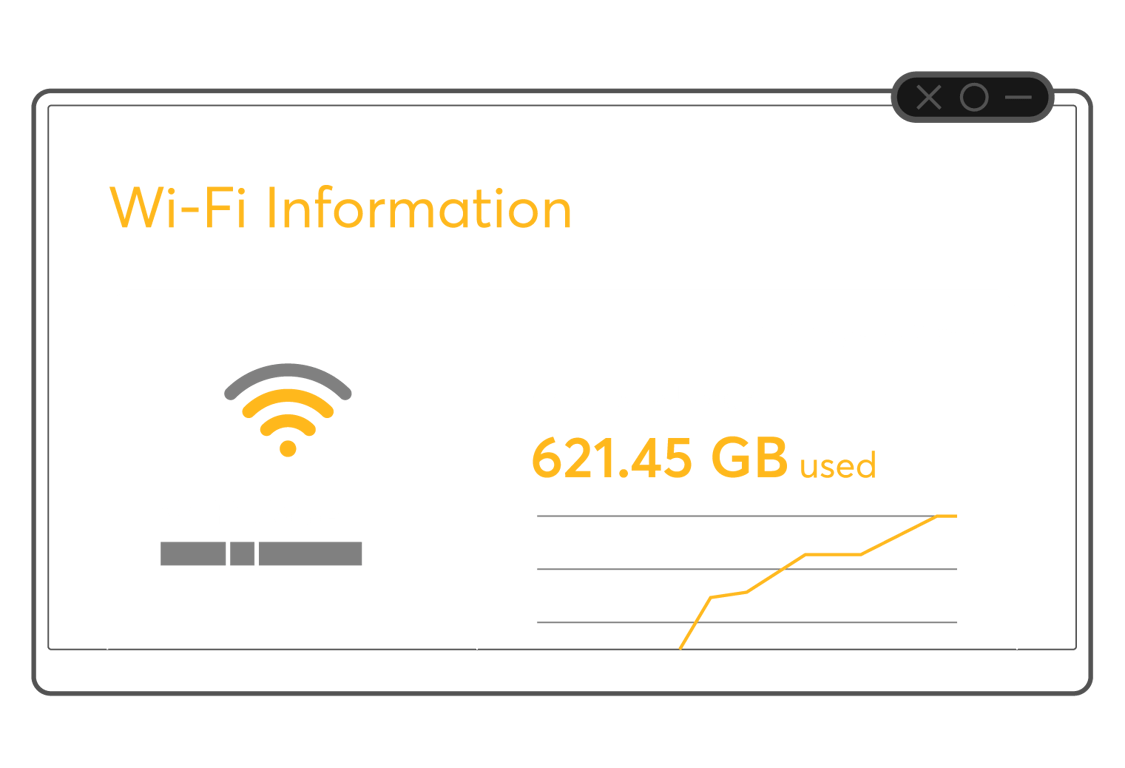
SSID Info & Usage
Retrieve SSID details, usage data, and profile information directly via the API, so your team can plan capacity and audit Wi-Fi usage across your device fleet without having to manually pull reports from InControl.
SpeedFusion VPN Status
Access SpeedFusion VPN tunnel and peer connection data directly via the API, so your team can build health checks, automate alerts, and report on bonded connectivity across distributed sites.
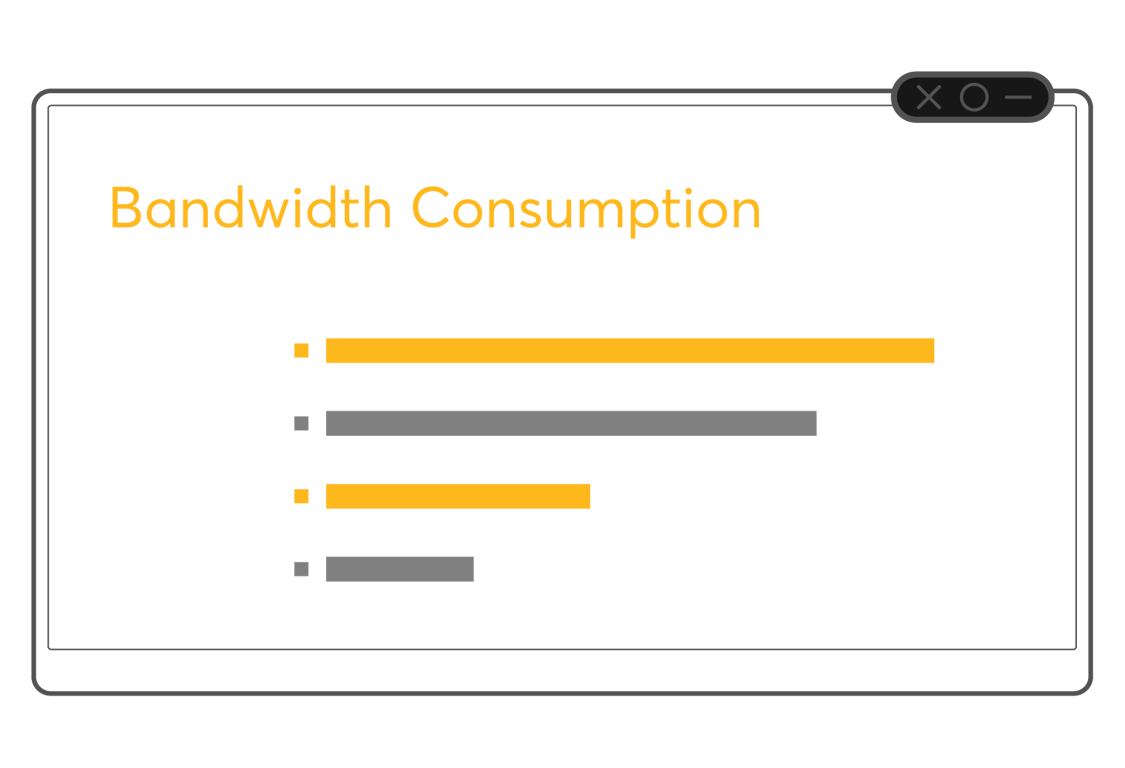
Billing Integration
Pull bandwidth consumption, uptime, and client counts into your billing or Professional Services Automation (PSA) platform. No manual exports required.
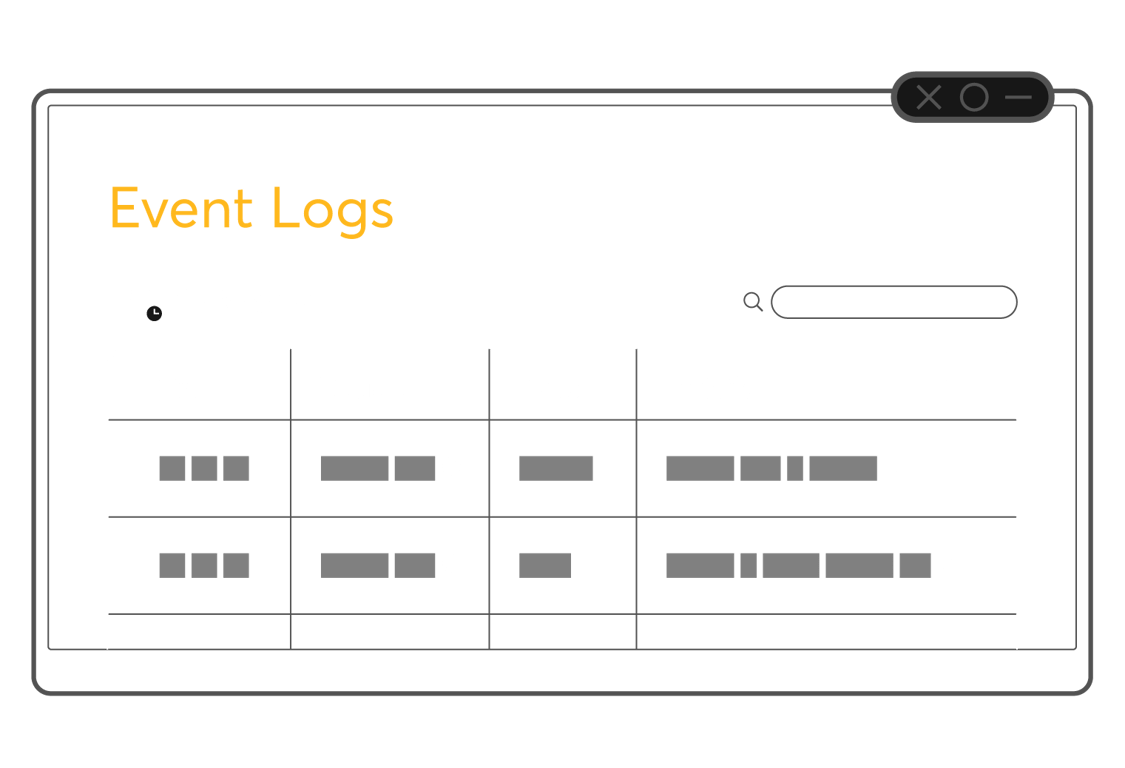
Event Logs
Access device and group-level event logs, including archived logs, directly via the API, so your team can manage compliance, maintain audit trails, and troubleshoot issues from within your own platform.
What’s Possible
Build Smarter Workflows with InControl API Data
Integrating InControl API into your platform unlocks workflows that weren't possible before, enabling more adaptive and automated operations.
Traffic Management
Use WAN status and connection health data to build logic that dynamically adjusts traffic distribution in your own platform, and trigger WAN priority changes without manual intervention.

Alerting
Raw network event data from the API gives your team the foundation to build smarter alerting, one that correlates events, reduces noise, and ensures your team is only notified when something genuinely needs their attention.

SLA Tracking
Continuously evaluate uptime and device performance to track whether SLAs are being met, enabling more accurate tracking and faster identification of potential risks.

Pattern Analysis
Feed historical network data into your own analytics tools to identify recurring issues, helping you anticipate problems and make smarter network decisions.
Ready to Integrate InControl into Your Platform?
Access the full API documentation to get started, or reach out to the Peplink team if you'd like guidance on the right integration approach to get the most value from your InControl investment.